Following a decline of about 9% against a basket of currencies this year, the dollar is poised to strengthen, according to technical patterns. The US currency pared some of its losses on Monday after US President Donald Trump announced tariffs of between 25% and 40% on America’s trading partners.
In the chart below, the currency’s relative value is measured by the US dollar index, which compares the dollar against its peers, including the euro, Japanese yen, British pound, Canadian dollar and Swedish krona.
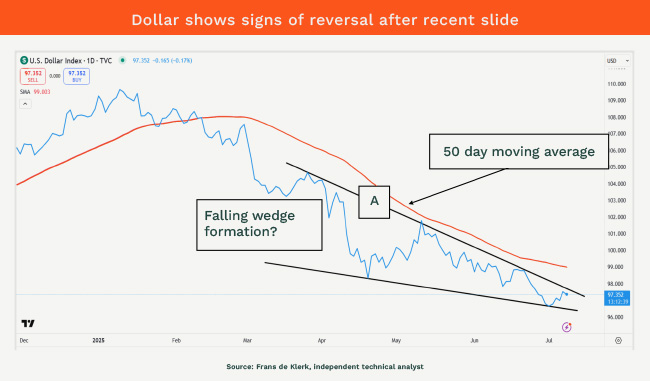
What we’re seeing here is a possible falling wedge formation, a pattern in which an index, stock or, in this case, the dollar has been falling, but when plotted along its highs and lows, it starts narrowing.
It then breaks upward through the upper resistance line on more substantial volume, which is typically seen as a bullish signal. The breakout suggests that selling pressure is easing, and the dollar could be poised for a meaningful rally – a potential shift that traders and investors would interpret as a reversal in momentum.
If the index breaks above 97.53, as it did on Tuesday, it could confirm the pattern and trigger a move higher, potentially toward 100.65 in time. That would mark a significant short-term recovery for the greenback.
Conversely, if the index dips below 96.37, the wedge would be invalidated, and the dollar could resume its decline. From there, it could target the following values: 96.32, 96.26, 96.20, 96.14, 96.11, 96.07, 96.00, 95.96, 95.89 and 95.73.
For traders: buy or go long above line A (97.53) (if you believe that the falling wedge may play out to the upside). However, use 95.96 as a stop loss to protect your capital. The possible targets to the top are: 97.56, 97.68, 97.81, 97.93, 98.00, 98.27, 98.34, 98.45, 98.67, 98.72, 98.87, 99.00, 99.09, 99.19, 99.23, 99.40, 99.56, 99.63, 99.74, 99.88, 99.98, 100.11, 100.23, 100.39, 100.48, 100.65 and 100.82.
Medium- to long-term investors can do the same, but should watch the 50-day moving average, which serves as a good barometer of sentiment. Below the average, investors are wary of the stock; above the average, they are positive, while the average is considered a resistance level.
This is the personal opinion of the writer and must not be taken as financial advice.
Frans de Klerk is an independent technical analyst.
Sign up to Currency’s weekly newsletters to receive your own bulletin of weekday news and weekend treats. Register here.