Spar, one of South Africa’s largest grocery and household goods retailers, may be setting up for a price recovery after a recent bout of weakness.
The chart below shows what may be a falling wedge pattern on Spar’s daily share price – a technical formation that, when confirmed, can signal a potential upward breakout. This suggests that Spar’s share price could be due for a rebound if it manages to break above a key resistance level.
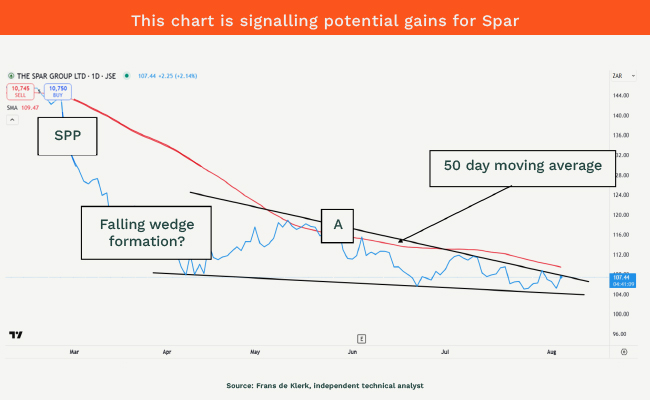
If the price rises above R107.45 (line A), the wedge pattern might push the share price up to R118.33 over time.
Short-term traders looking to capitalise on the potential upside can consider buying above R107.45 – but should set a stop loss at R102.43 to protect against potential losses. The possible targets to the top are: R108.56, R109.63, R110.38, R111.66, R112.36, R113.32, R114.89, R115.70, R116.42, R117.65, R118.33, R119.67 and R120.
Longer-term investors can follow the same strategy, but with added caution. Spar’s 50-day moving average currently sits at R109.65 – a key level to watch. If the share price stays below this average, investor sentiment is likely cautious. A move above the average could confirm a more positive trend.
The 50-day average acts as a sentiment gauge. Above it, investors are optimistic; below it, they’re wary.
The outlook isn’t guaranteed. If the share price drops below R104.23, Spar could face further declines, and levels to watch there are: R103.62, R102. 43, R101.34, R100, R99.89, R98.65, R97.21, R96.56, R95.83, R94.30 and even R93.72.
Frans de Klerk is an independent technical analyst. This is the personal opinion of the writer and must not be taken as financial advice.
Sign up to Currency’s weekly newsletters to receive your own bulletin of weekday news and weekend treats. Register here.