Platinum spiked to a record high of about $2,900 an ounce this week as precious metals surged in a risk-off rush. But momentum has started to cool. As the candlestick chart below shows, a drop below $2,614 would make a pullback more likely; a push above $2,919 would strengthen the case that the rally can continue. Platinum was last at about $2,690 on Tuesday, down about 7% on the day.
Platinum sits in a group with five other rare, precious and chemically similar elements – palladium, rhodium, ruthenium, iridium and osmium. South Africa is the world’s largest producer of platinum group metals.
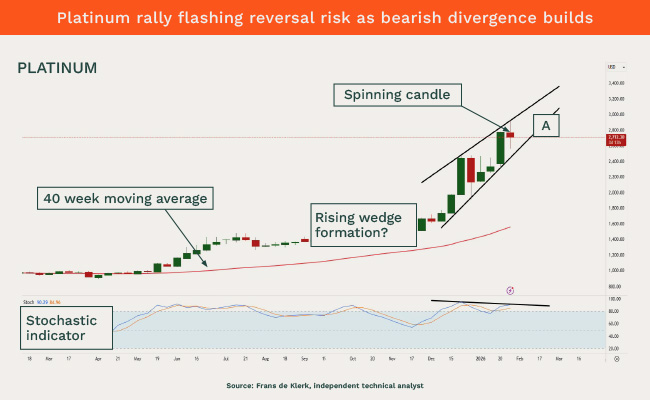
What it means:
- A gauge of whether buyers are losing steam, known as the stochastic indicator (the bottom chart), shows a negative divergence that might trigger selling.
- The possible rising wedge formation acts as a warning that a reversal is possible, because while prices are rising, each push higher is weaker.
- The spinning candle (which has a smaller range between its highest and lowest levels during a day) confirms that some uncertainty is on the rise. Below line A ($2,614), the wedge can come into play, and we may see prices fall to as low as $2,100.
- Above $2,919, the price may go even higher, wiping the warning signal off the table. Possible targets are: $2,945; $2,967; $2,989; $3,000; $3,043; $3,089; $3,106; $3,145 and $3,200.
- For traders, consider selling below line A if you believe the rising wedge formation may play out to the downside. Think of using $2,732 as a stop loss to protect capital. The possible targets to the bottom are: $2,578; $2,532; $2,500; $2,443; $2,430; $2,393; $2,356; $2,318; $2,289; $2,256; $2,230; $2,187; $2,134 and $2,100.
- For medium- to long-term investors, consider reducing exposure below line A. It may be time to get worried when $2,318 becomes the resistance level. The 40-week moving average (red line at $1,563) is a good sentiment barometer for investors. Below the average, signals are wary; above it, they are positive.
This is the personal opinion of the writer and must not be taken as financial advice. Frans de Klerk is an independent technical analyst.
Sign up to Currency’s weekly newsletters to receive your own bulletin of weekday news and weekend treats. Register here.