The National Treasury has unveiled its procurement “dashboard”, which director-general Duncan Pieterse sees as a milestone for transparency, and the first brick in a far more ambitious architecture of accountability.
The result is both revealing – and confusing. There is some broad analysis of the data, but much basic analysis is lacking.
The procurement dashboard draws the raw payment data of government departments from the state’s Basic Accounting System (BAS), presenting it in a central, public-facing format.
“We had always published procurement information,” says Pieterse, “but not in an integrated, systematic or comprehensive way.”
Basically, Treasury needed something that met modern “open data” standards – that would allow civil society, journalists, analysts and parliament to interrogate expenditure with far less friction, Pieterse says in an interview with Currency.
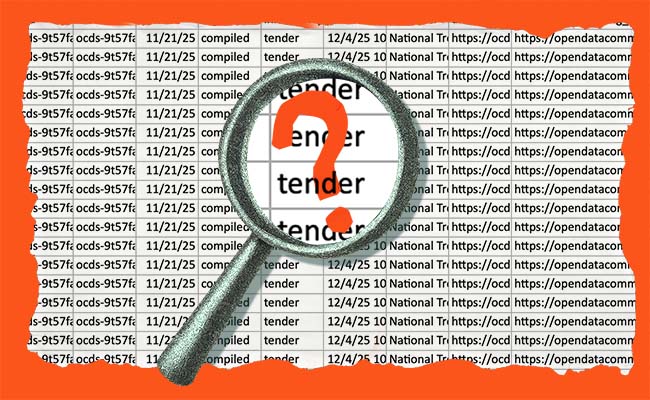
Public procurement processes are public information, but the procedures around them are often complex, and transparency is limited. That means it’s hard to sniff out any tender irregularities – even if you know what to look for.
So the introduction of the procurement payments dashboard is a pretty big deal.
The dashboard allows all South Africans to dig through tender information online; it holds a wealth of information based on national and provincial reporting of procurement spend on goods and services. You can scroll through the list of suppliers, see which departments they supplied, for what purpose and for how much.
The data on spending goes all the way back to 2017 and provides a blow-by-blow account of every rand spent by departments over the past eight years. It is a ridiculously large excel spreadsheet, but the information is all there – more or less.
For example, while you can see that the Western Cape provincial treasury spent exactly R1.00 on airtime and data in 2025/26, a fair amount of crucial information is missing.
Only 25% of government spend
For a start, the BAS system does not list state-owned enterprise (SOE) and municipal tenders. Pretty unfortunate, given that most of the more shocking tender corruption scandals that come to mind are from SOEs and municipalities. Also, some government departments are not represented because they are not on the BAS system, including defence, the police, the South African Revenue Service and the State Security Agency.
The current dashboard only accounts for about 25% of total government spend – as Pieterse says, it is still very much a work in progress.
Of the top 10 government entities to procure the most tenders in 2025, only three are listed on the BAS system, with the big spenders like Eskom, Joburg Water and Transnet still not sharing their data on the BAS system.
But, Pieterse says, the current dashboard is just the start, and the missing government departments will be added in due course. Treasury has now issued a Public Finance Management Act (PFMA) instruction note requiring all PFMA-governed entities outside BAS to use a new data upload tool from early 2026. Municipalities will get a similar upload system next year.
The eventual goal: a single transparency net that captures the entire public sector. “Everyone will come into the net,” Pieterse says.
‘Crowding in capacity’
The other thing that is obvious is that the dashboard was released with almost no internal analytical overlay. Treasury made a conscious decision not to spend a year doing its own analysis before publishing. That would, in Pieterse’s view, have defeated the purpose.
“Part of this is crowding in analytical capacity,” he says. “The idea is to get as many people as possible looking at this.” Treasury wants researchers, activists, media and the public to help identify anomalies – like provinces spending wildly different amounts on fleet management or security with no obvious underlying logic.
“What we didn’t want to do is to do the dashboard, sit on it for a year, do our own analytical work, and then launch the dashboard a year later,” says Pieterse.
But when it comes to considering questions such as why there is such a disparity in provincial spending on restaurants and catering, for example, Treasury has no answers. The Eastern Cape spent a staggering R48m on this category in 2025/26, while the next highest amount was R27m, spent by Mpumalanga. Gauteng spent a measly R19m on its banqueting.
Fleet services, the single largest spend by category, provided by FNB Fleet Services for example, show huge anomalies when comparing provinces. North West, one of the smallest provinces, is spending almost as much as KwaZulu-Natal, one of the biggest provinces.
This is partly accounted for by the fact that one fleet service company will not provide services to all departments. What is required is a metric, like spend per vehicle, that would highlight over-expenditure – but that is not available yet.
‘Scratching the surface’
The dashboard also shows payments, not procurement decisions. It is entirely backward looking. It records who has already been paid, not who is about to be appointed.
Nor does Treasury receive most procurement data in advance – only deviations from standard tender procedures must be reported within 14 days. Everything else arrives after the money has already left government coffers.
This explains the missing beneficiaries, the odd gaps, and the inability – so far – to flag suspect tenders. As Pieterse puts it, this is “a dashboard that scratches the surface”.
ALSO READ:
- Bucket hats and bottomless pockets: Inside the RAF’s R1bn marketing meltdown
- Zondo-linked case took off in US, stalled at home
- Road to ruin: RAF scandal prompts full-scale probe
Top image: eTenders portal; Rawpixel/Currency collage.
Sign up to Currency’s weekly newsletters to receive your own bulletin of weekday news and weekend treats. Register here.