Markets have moved quickly since the escalation around Iran. Oil has spiked, the dollar has strengthened, gold has come under pressure and equity markets around the world have pulled back.
Behind these moves is something important: markets process enormous amounts of information almost instantaneously.
When an event like this occurs, investors and institutions reprice risk almost immediately, using a mix of models, judgment and positioning. By the time most people hear the news, markets have usually moved.
That’s what makes markets so fascinating. What we’re seeing is a recalibration based on new information, and the result shows up in one place: prices.
Take oil, for example.
Every movement in the oil price reflects a shift in expectations about supply, demand and risk. The recent spike is not random. It is the market’s assessment of what could happen next.
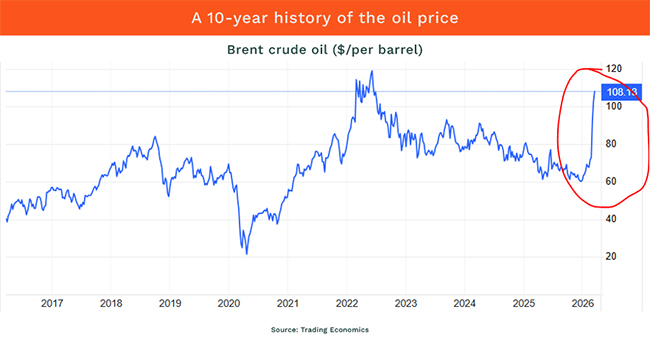
The spike circled in red is the largest price move in oil over the past 10 years. It reflects the market’s assessment of all available information.
The speed and magnitude of that move tell us less about what has happened and more about how uncertain the range of outcomes has become.
At the centre of these moves is the Strait of Hormuz, one of the most important geographical features in the world.
This narrow stretch of water sits between Iran and Oman and connects the Persian Gulf to the open ocean. Almost every oil tanker leaving Saudi Arabia, Iraq, Kuwait, Qatar and the United Arab Emirates must pass through this channel.
The map below illustrates this clearly.
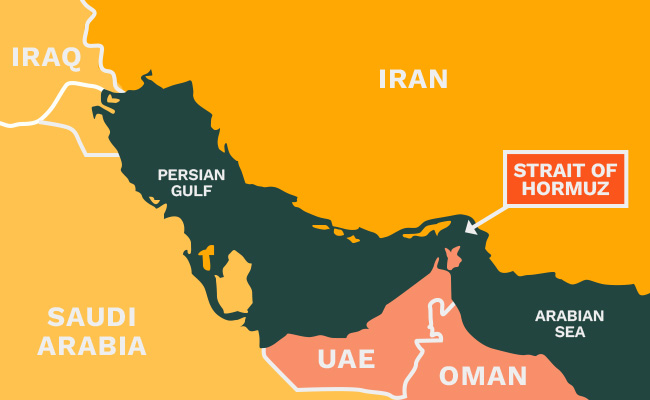
Around 25% of the world’s seaborne oil and roughly 20% of global liquefied natural gas flows through it each year. If something disrupts that route, energy markets react immediately.
That is exactly what we are seeing now.
Capital flows
But oil is just one part of the puzzle.
When energy prices rise, inflation expectations tend to move higher. At the same time, uncertainty increases, and investors seek safety.
We are seeing this reflected in market prices.
For example, the rand has weakened to about R17/$. But this is less a South Africa-specific move and more a reflection of broad dollar strength. During periods of stress, global capital tends to flow towards the US.
This is clearly visible in the US dollar index, which tracks the dollar against a basket of major currencies.
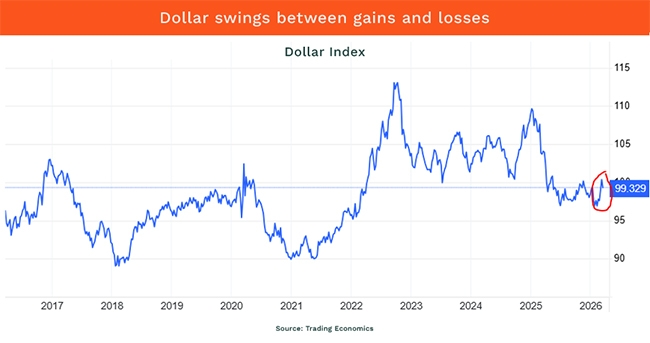
Looking at the longer-term chart helps put the recent move in context. While the recent spike appears significant over shorter periods, it is far less dramatic when viewed against the past decade.
There are three points worth highlighting.
First, despite frequent headlines predicting the end of the dollar’s dominance, it remains the world’s primary safe-haven currency. It has strengthened against most major currencies since the escalation.
Second, while the recent move has been sharp, it is not yet a sustained trend. Previous periods, particularly during Covid and the inflation surge in 2022, saw far more significant moves. We are nowhere near those levels.
Third, the strength of the dollar has important knock-on effects. Gold, for example, is priced in US dollars. While it typically acts as a safe-haven asset, a stronger dollar can place pressure on the gold price. Gold is currently about 20% below its record highs.
The key point is that these moves are still in their early phase. They may prove to be short-lived or develop into something more sustained.
At this stage, the market has not made that call.
How low can it go?
Equity markets are reflecting the same uncertainty. The S&P 500 is down about 5% from recent highs, its first meaningful pullback of the year, while the JSE all share is down almost 15% from its earlier peak.
That naturally raises the question investors always ask during periods like this: how long will the decline last, and how deep will it go?
The honest answer is simple: no-one knows.
It could end this week. It could last several months. In more extreme scenarios, it could stretch longer.
That uncertainty is uncomfortable, but it is also the reason stocks outperform bonds and cash over long periods. If the future were predictable, there would be no reward for taking risks.
Periods like this create a strong temptation to act.
Looking at history, there have always been moments that felt like the right time to exit the market: wars, recessions, financial crises, oil shocks and geopolitical conflicts.
Missing the recovery
The problem is that these moments always feel different while we are in them. There is always a reason to sell.
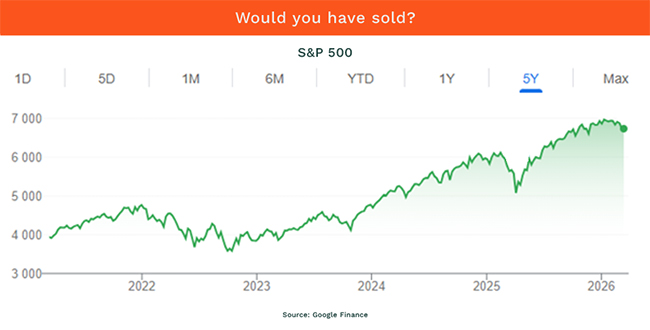
And yet when we look back at market history, the same pattern appears again and again. Investors who sell often struggle to decide when to get back in, and many end up missing the recovery.
Despite wars, recessions, oil shocks and geopolitical conflicts, markets have continued to move higher over the long run.
We can’t control short-term volatility, but we can control how we respond to it.
We don’t know what will happen in the next few weeks or months. But history gives us a very good guide as to what tends to happen over the next few decades.
The current situation feels significant, as these moments always do, but history suggests the greater risk is not the event itself, but how we respond to it.
Matthew Matthee runs a wealth management practice in Knysna, specialising in retirement planning and investments.
ALSO READ:
- South Africans rue gold’s plunge — and it could get a heap worse
- Smart trade for the Gulf meltdown: Don’t look
- Oil is surging. Why Sasol and Thungela are up and the JSE is down
Top image: Rawpixel/Currency collage.
Sign up to Currency’s weekly newsletters to receive your own bulletin of weekday news and weekend treats. Register here.