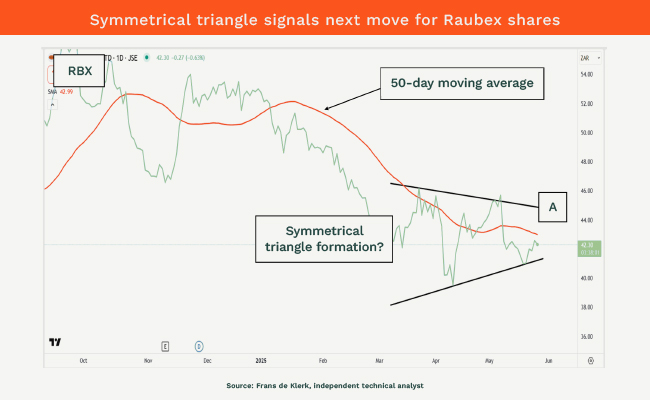
Raubex’s share price has been stuck in a range, but that could soon change for the South African construction company.
The chart below shows a potential symmetrical triangle – a formation that often appears after a nasty sell-off and could signal indecisiveness by investors, as buyers and sellers consider what to do next.
These formations can break either way, and the direction of the breakout typically sets the tone for what follows.
The key level to watch is R44.94. A move above that could trigger a rally towards R49.53, with several minor resistance points along the way. But if the price falls below R41.50, momentum could shift lower, with potential downside targets as low as R39.
A critical marker for medium-term sentiment is the 50-day moving average, currently at R43.12. If Raubex climbs above this line, it could indicate the first signs of strength. Until then, the trend is still considered weak.
A break above R44.94 could offer a buying opportunity, but only if you believe the symmetrical triangle may break to the upside. Risk management is key, so using a stop-loss near R41.62 can help protect capital if the trade turns against you.
If momentum builds, the possible targets towards the top are: R45, R45.23, R45.67, R45.90, R46.33, R46.89, R47, R47.54, R47.78, R48, R48.12, R48.49, R49.43, R49.53, R49.90, R50.49, R50.76, R51.21, R51.88 and R52.13.
For medium-term investors, the 50-day moving average is a key measure of sentiment. When the share trades above it, it’s a signal that confidence may return. But below it, investors start to grow cautious. The average acts as a resistance barrier.
This trading suggestion reflects the personal opinion of the writer and must not be taken as financial advice.
Frans de Klerk is an independent technical analyst.
Sign up to Currency’s weekly newsletters to receive your own bulletin of weekday news and weekend treats. Register here.